Visualisation
Although argopy focus is not on visualisation, it provides a few functions to get you started.
A gallery of examples is in preparation for a future release.
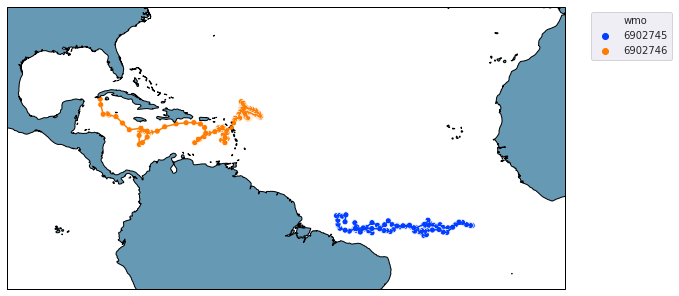
Trajectories from an index
from argopy import IndexFetcher as ArgoIndexFetcher
idx = ArgoIndexFetcher().float([6902745, 6902746])
idx.to_dataframe()
idx.plot('trajectory')
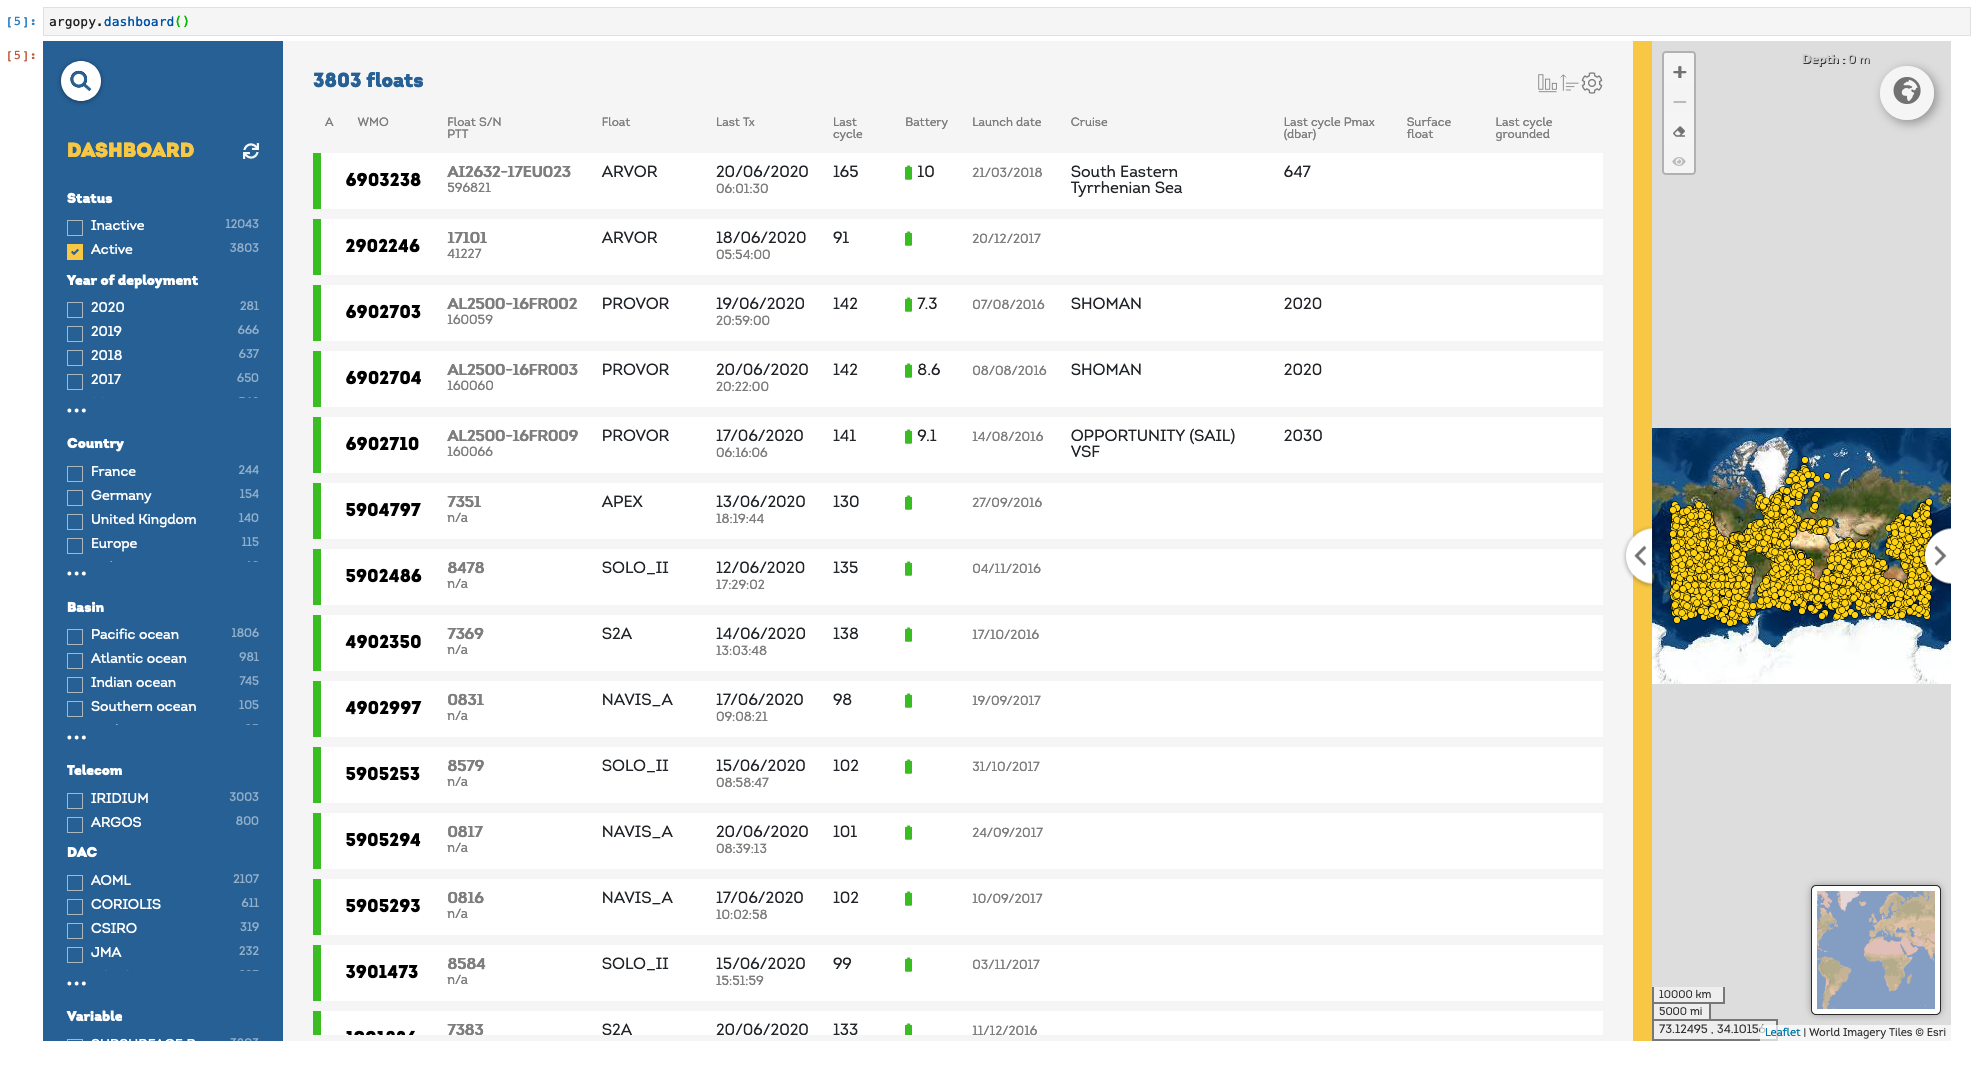
Float dashboard
When working in Jupyter notebook, you can insert the EuroArgo dashboard in a cell with:
import argopy
argopy.dashboard()
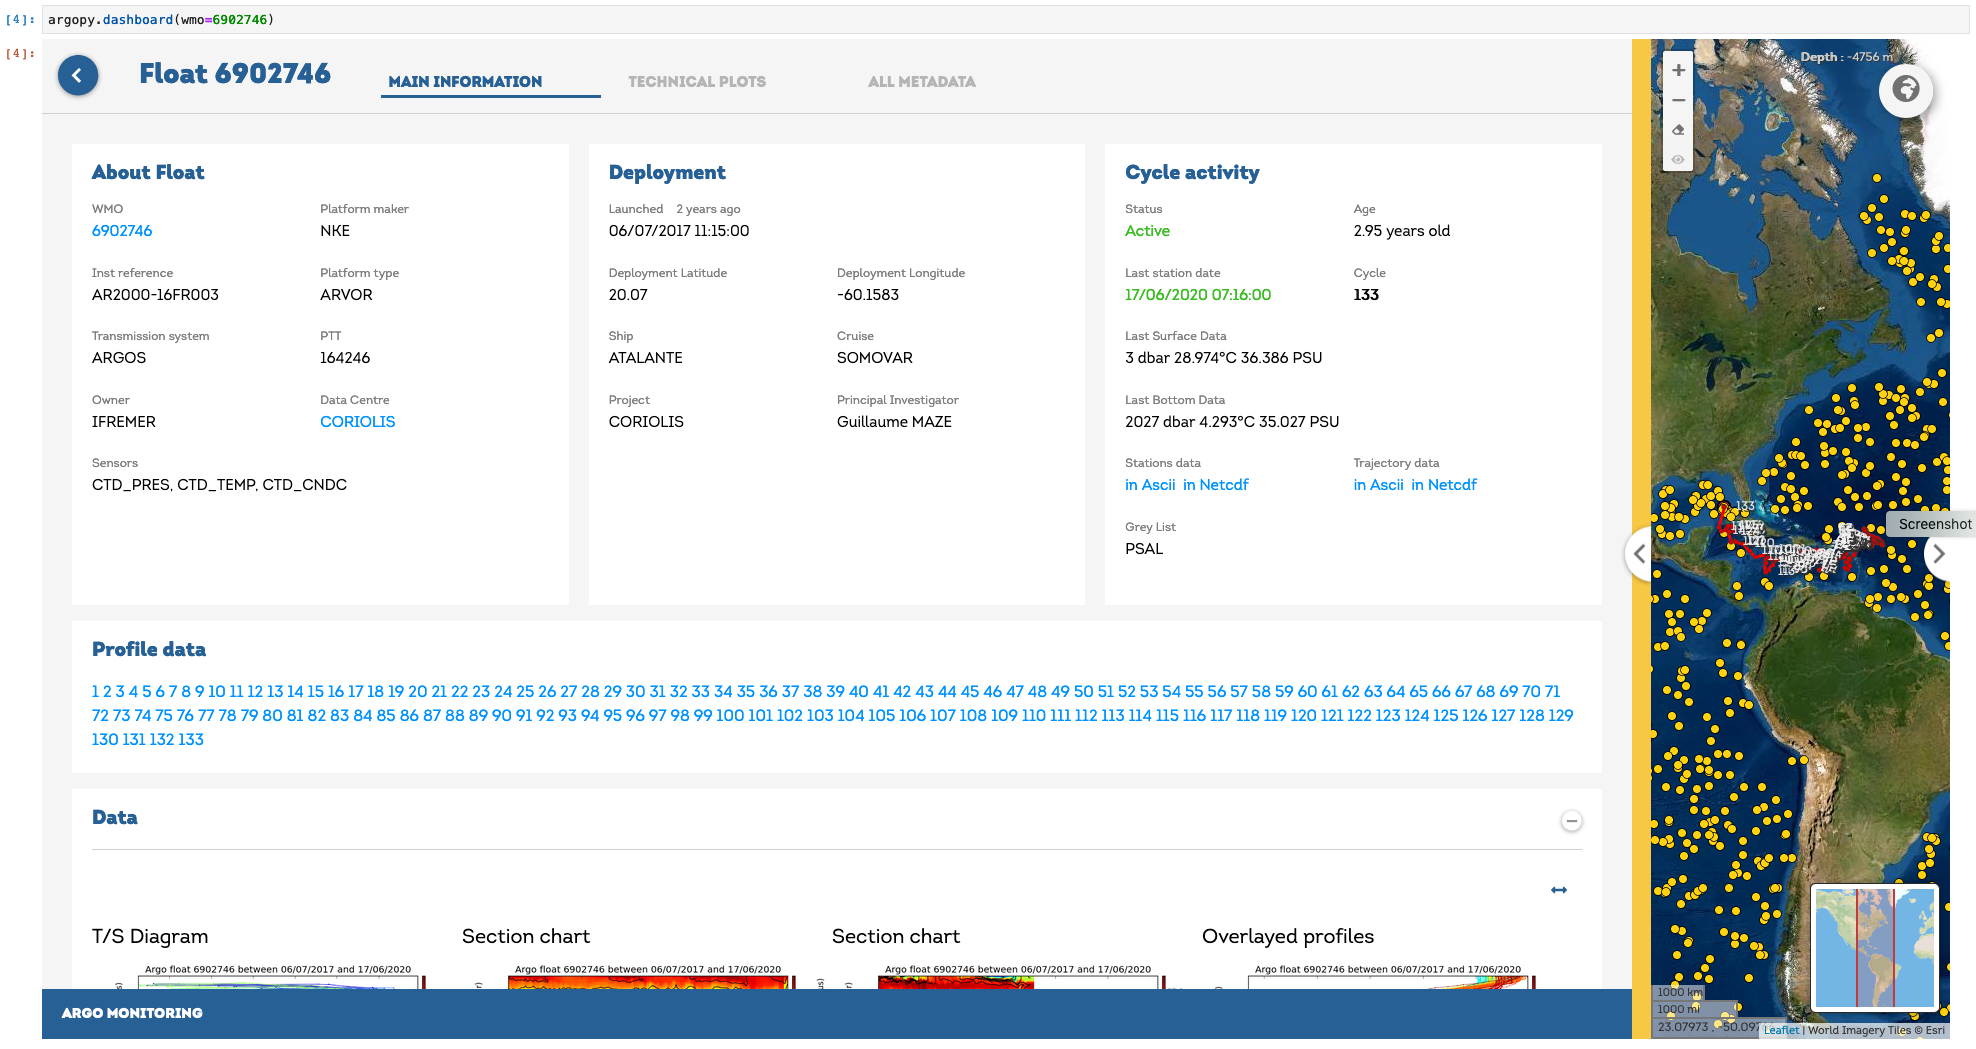
and for a specific float, just provide its WMO:
import argopy
argopy.dashboard(wmo=6902746)