Fetching Argo data#
To fetch (i.e. access, download, format) Argo data, argopy provides the DataFetcher class. In this section of the documentation, we explain how to use it.
Several DataFetcher arguments exist to help you select the dataset, the data source and the user mode the most suited for your applications; and also to improve performances.
You define the selection of data you want to fetch with one of the DataFetcher methods: region, float or profile.
These methods and arguments are all explained in the following sections:
In a nutshell#
2 lines to download Argo data: import and fetch !
In [1]: import argopy

In [2]: ds = argopy.DataFetcher().region([-75, -45, 20, 30, 0, 10, '2011-01', '2011-06']).load().data
In [3]: ds
Out[3]:
<xarray.Dataset> Size: 120kB
Dimensions:          (N_POINTS: 998)
Coordinates:
    LATITUDE         (N_POINTS) float64 8kB 24.54 24.54 25.04 ... 24.96 24.96
    LONGITUDE        (N_POINTS) float64 8kB -45.14 -45.14 -51.58 ... -50.4 -50.4
    TIME             (N_POINTS) datetime64[ns] 8kB 2011-01-01T11:49:19 ... 20...
  * N_POINTS         (N_POINTS) int64 8kB 0 1 2 3 4 5 ... 993 994 995 996 997
Data variables: (12/15)
    CYCLE_NUMBER     (N_POINTS) int64 8kB 23 23 10 10 10 10 ... 5 2 10 10 38 38
    DATA_MODE        (N_POINTS) <U1 4kB 'D' 'D' 'D' 'D' 'D' ... 'D' 'D' 'D' 'D'
    DIRECTION        (N_POINTS) <U1 4kB 'A' 'A' 'A' 'A' 'A' ... 'A' 'A' 'A' 'A'
    PLATFORM_NUMBER  (N_POINTS) int64 8kB 1901463 1901463 ... 1901463 1901463
    POSITION_QC      (N_POINTS) int64 8kB 1 1 1 1 1 1 1 1 1 ... 1 1 1 1 1 1 1 1
    PRES             (N_POINTS) float32 4kB 5.0 10.0 2.0 4.0 ... 9.42 5.0 10.0
    ...               ...
    PSAL_ERROR       (N_POINTS) float32 4kB 0.01 0.01 0.01 ... 0.01091 0.01182
    PSAL_QC          (N_POINTS) int64 8kB 1 1 1 1 1 1 1 1 1 ... 1 1 1 1 1 1 1 1
    TEMP             (N_POINTS) float32 4kB 24.08 24.08 24.03 ... 25.1 24.79
    TEMP_ERROR       (N_POINTS) float32 4kB 0.002 0.002 0.002 ... 0.002 0.002
    TEMP_QC          (N_POINTS) int64 8kB 1 1 1 1 1 1 1 1 1 ... 1 1 1 1 1 1 1 1
    TIME_QC          (N_POINTS) int64 8kB 1 1 1 1 1 1 1 1 1 ... 1 1 1 1 1 1 1 1
Attributes:
    DATA_ID:              ARGO
    DOI:                  http://doi.org/10.17882/42182
    Fetched_from:         erddap.ifremer.fr
    Fetched_by:           docs
    Fetched_date:         2026/07/01
    Fetched_constraints:  [x=-75.00/-45.00; y=20.00/30.00; z=0.0/10.0; t=2011...
    Fetched_uri:          https://erddap.ifremer.fr/erddap/tabledap/ArgoFloat...
    Processing_history:   [PRES,TEMP,PSAL] real-time and adjusted/delayed var...
Workflow explained#
Let’s explain what happened in the single line Argo data fetching above.
Import argopy and create a instance of DataFetcher:
In [4]: import argopy

In [5]: f = argopy.DataFetcher()

In [6]: f
Out[6]:
<datafetcher.erddap> 'No access point initialised'
Available access points: float, profile, region
🏊 User mode: standard
🟡+🔵 Dataset: phy
🌥  Performances: cache=False, parallel=False
By default, argopy will load the phy dataset, in standard user mode from the erddap data source.
Once you have a DataFetcher, you must select data. As an example, here is a space/time data selection:
In [7]: f = f.region([-75, -45, 20, 30, 0, 10, '2011-01', '2011-06'])

In [8]: f
Out[8]:
<datafetcher.erddap>
⭐ Name: Ifremer erddap Argo data fetcher for a space/time region
🗺  Domain: [x=-75.00/-45.00; y=20.00/30.00; z=0.0/10.0; t=2011-01-01/2011-06-01]
🔗 API: https://erddap.ifremer.fr/erddap
🏊 User mode: standard
🟡+🔵 Dataset: phy
🌥  Performances: cache=False, parallel=False
Once you defined a data selection, data fetching will be triggered if you access one of the DataFetcher properties:
data, this is axarray.Datasetwith all Argo data in the selection,index, this is apandas.DataFramewith a list of profiles in the selection.
In [9]: f.data
Out[9]:
<xarray.Dataset> Size: 120kB
Dimensions:          (N_POINTS: 998)
Coordinates:
    LATITUDE         (N_POINTS) float64 8kB 24.54 24.54 25.04 ... 24.96 24.96
    LONGITUDE        (N_POINTS) float64 8kB -45.14 -45.14 -51.58 ... -50.4 -50.4
    TIME             (N_POINTS) datetime64[ns] 8kB 2011-01-01T11:49:19 ... 20...
  * N_POINTS         (N_POINTS) int64 8kB 0 1 2 3 4 5 ... 993 994 995 996 997
Data variables: (12/15)
    CYCLE_NUMBER     (N_POINTS) int64 8kB 23 23 10 10 10 10 ... 5 2 10 10 38 38
    DATA_MODE        (N_POINTS) <U1 4kB 'D' 'D' 'D' 'D' 'D' ... 'D' 'D' 'D' 'D'
    DIRECTION        (N_POINTS) <U1 4kB 'A' 'A' 'A' 'A' 'A' ... 'A' 'A' 'A' 'A'
    PLATFORM_NUMBER  (N_POINTS) int64 8kB 1901463 1901463 ... 1901463 1901463
    POSITION_QC      (N_POINTS) int64 8kB 1 1 1 1 1 1 1 1 1 ... 1 1 1 1 1 1 1 1
    PRES             (N_POINTS) float32 4kB 5.0 10.0 2.0 4.0 ... 9.42 5.0 10.0
    ...               ...
    PSAL_ERROR       (N_POINTS) float32 4kB 0.01 0.01 0.01 ... 0.01091 0.01182
    PSAL_QC          (N_POINTS) int64 8kB 1 1 1 1 1 1 1 1 1 ... 1 1 1 1 1 1 1 1
    TEMP             (N_POINTS) float32 4kB 24.08 24.08 24.03 ... 25.1 24.79
    TEMP_ERROR       (N_POINTS) float32 4kB 0.002 0.002 0.002 ... 0.002 0.002
    TEMP_QC          (N_POINTS) int64 8kB 1 1 1 1 1 1 1 1 1 ... 1 1 1 1 1 1 1 1
    TIME_QC          (N_POINTS) int64 8kB 1 1 1 1 1 1 1 1 1 ... 1 1 1 1 1 1 1 1
Attributes:
    DATA_ID:              ARGO
    DOI:                  http://doi.org/10.17882/42182
    Fetched_from:         erddap.ifremer.fr
    Fetched_by:           docs
    Fetched_date:         2026/07/01
    Fetched_constraints:  [x=-75.00/-45.00; y=20.00/30.00; z=0.0/10.0; t=2011...
    Fetched_uri:          https://erddap.ifremer.fr/erddap/tabledap/ArgoFloat...
    Processing_history:   [PRES,TEMP,PSAL] real-time and adjusted/delayed var...
In [10]: f.index
Out[10]:
                   date  latitude  longitude      wmo  cyc
0   2011-01-02 11:26:40    27.829    -56.303  1901461   23
1   2011-01-12 11:44:20    27.988    -56.378  1901461   24
2   2011-01-22 11:23:26    27.891    -55.865  1901461   25
3   2011-02-01 11:18:38    27.538    -54.669  1901461   26
4   2011-02-11 11:46:04    27.487    -53.686  1901461   27
..                  ...       ...        ...      ...  ...
462 2011-05-02 01:22:10    27.134    -71.040  6901050    2
463 2011-05-12 01:25:11    27.498    -70.044  6901050    3
464 2011-05-20 16:30:09    21.120    -57.985  6901051    1
465 2011-05-30 16:18:21    21.489    -58.071  6901051    2
466 2011-05-25 20:08:09    21.072    -52.625  6901052    1

[467 rows x 5 columns]
These fetcher properties call on the DataFetcher.load() method, which in turn, calls either DataFetcher.to_xarray() or DataFetcher.to_index() if data structures are not already in memory.
Note that the DataFetcher.to_xarray() and DataFetcher.to_index() will force data download on every call, while the DataFetcher.load() method will keep data in memory in the DataFetcher.data and DataFetcher.index properties.
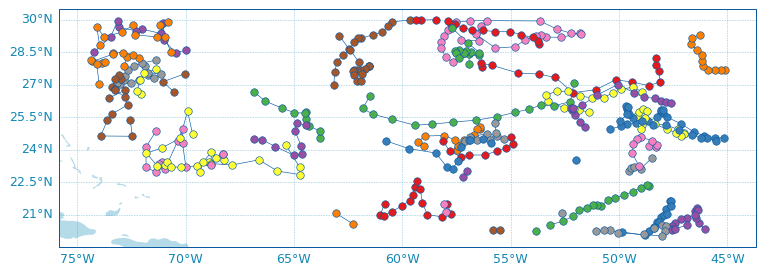
If you wish to quickly look at your data selection, you can call on the DataFetcher.plot().
f.plot('trajectory', add_legend=False)
If you selected data for a float, the DataFetcher.dashboard() method can also be used.
See the Data visualisation section for more details on argopy data visualisation tools.
Hint
The DataFetcher.domain property will also give you the space/time domain covered by your data selection.
In [11]: f.domain  # [lon_min, lon_max, lat_min, lat_max, pres_min, pres_max, date_min, date_max]
Out[11]:
[-74.37700000000001,
 -45.118,
 20.018,
 29.995,
 1.0,
 10.4,
 numpy.datetime64('2011-01-01T11:49:19.000000000'),
 numpy.datetime64('2011-05-31T11:34:52.000000000')]